Summary
From the 27th December 2018 the Solomon Islands experienced two weeks of intense rainfall due to the rapid succession of three tropical storms. Firstly, a tropical depression that later turned into Cyclone Mona crossed the country bringing heavy downpours and high winds. This was followed by another tropical depression that formed nearby and lingered over the Solomon’s due to being sandwiched between Cyclone Penny to the south and another system to the west. A weather station in Honiara/Henderson recorded a total of 350mm of rain during this period. These heavy downpours caused rivers to burst their banks and flash flooding to occur.
On the 6th January the National Emergency Operations Centre (NEOC) reported that an estimated 23,708 people had been affected with homes and crops destroyed. Flash flooding also contaminated drinking water. This damage was captured both on the ground and through satellite imagery produced by China GEO from the 25th January 2019.
Site Extent
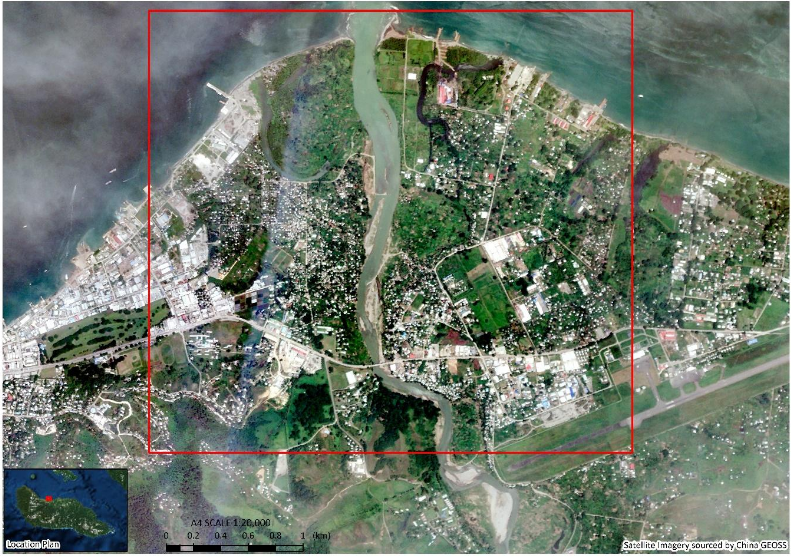 Honiara is situated on the island of Guadalcanal, the largest in the Solomon Islands archipelago. It is volcanic in origin and ranges in topography from tall mountain ranges to low- lying coral atolls. The Guadalcanal Island has three main rivers the Mataniko, Lunga and Tenaru rivers. The China GEO supported satellite imagery from CGSTL was flown over the wider Honiara area, encapsulating all three rivers. The river of interest, the Lunga River and the site extent for analysis is shown in Figure 1.
Damage Scenario
Severe damage to both the natural and built environment occurred due to the continuous intense rainfall over the Honiara area in late December 2018 through to January 2019. The damage to the built environment, mostly consisting of family homes, was more concentrated compared to the damage to crop land and food gardens which was more widespread.
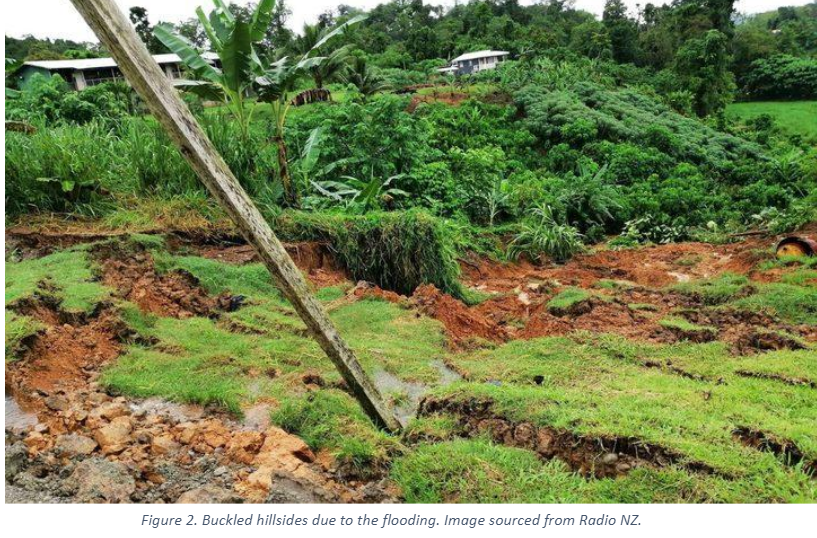 A large amount of crop land was destroyed as a result of the constant inundation of water, which also caused hillsides to buckle as shown in Figure 2. Root crops and vegetables were destroyed meaning economic loss for majority of the island. Eighty five percent of the community are subsistence farmers therefore, the crops destroyed are their primary source of food. This means that crop damage causes not only an economic loss but a detrimental effect on community life and health through severe food shortages. The cocoa, cassava and fishing industries were also impacted by the flood waters.
Family homes were damaged due to the constant rain and inundation of water, which left many people homeless. The rain and associated wind caused roofs to collapse and landslides to occur. The landslides causing communities to be blocked off. More than 22,000 people had their homes or cropland destroyed. The majority of communities do not have proper water networks, therefore wells and streams are the main source of drinking water. The flooding caused contamination of water ways and increased the likelihood of mosquito-borne diseases and secondary impacts on the community such as diarrhoea.
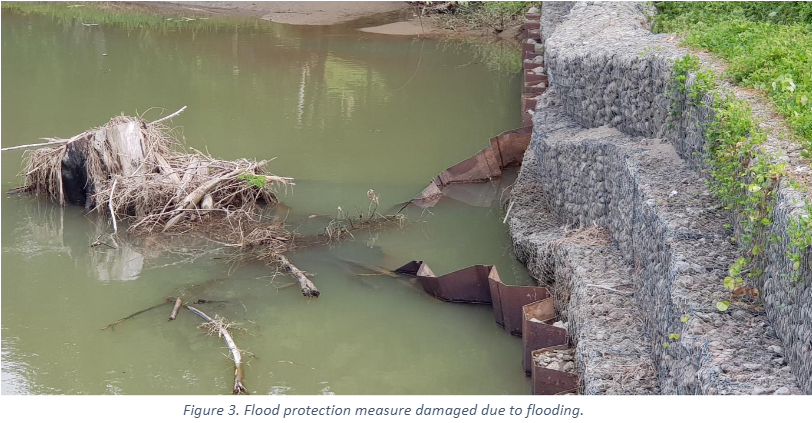 The flooding also caused damage to infrastructure such as road networks and stopbanks. As seen in Figure 3, the force of the water ripped/bent the corrugated iron holding the rock mesh together. Damage to these key protection measures and roading networks can inhibit aid reaching affected areas and cause future inundation where resilient systems have been damaged.
Analysis of New Year Flood
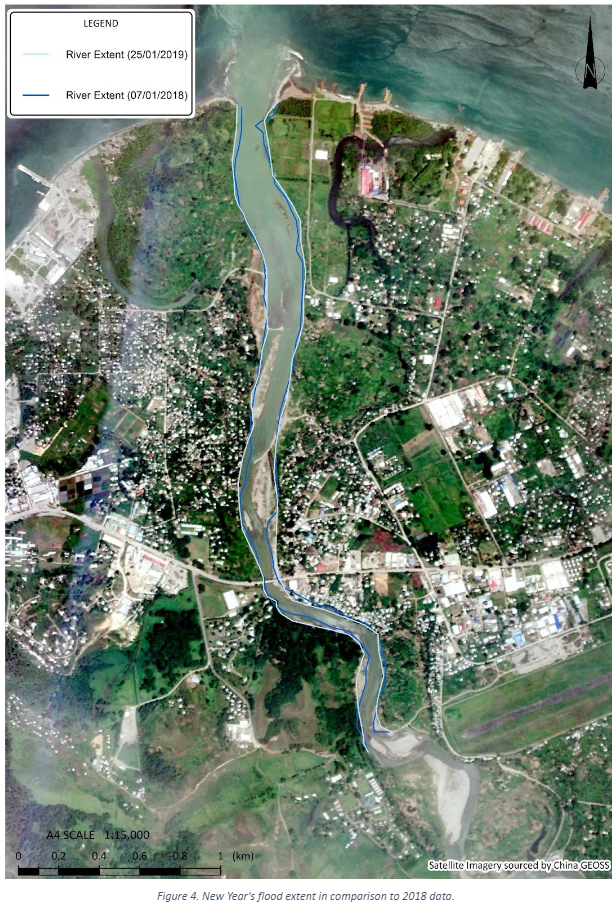 Responding to requests from CODATA/LODGD, China GEO activated its Disaster Data Response (CDDR) Mechanism to provide high-resolution satellite imagery in support of disaster response planning. Analysis of the New Year Flood was undertaken using 2m resolution satellite provided by China GEO from the 25th January 2019. The high resolution imagery was used to depict the extent of the flood water, which was indicative of the potential impacts for the surrounding community. The flooding extent was depicted from the satellite imagery using ArcGIS. To understand what the river and water extent was before the New Year’s flooding event, images from Google Earth were used. The comparison between the New Year Flood Extent and the river extent from the 7th January 2018 is shown in Figure 4. The imagery and river extent from the 7th January 2018 acts as a control for how the river is in its “normal” state, therefore the comparison allows for an understanding of the disaster event.
Discussion and Recommendations
High resolution satellite imagery is crucial data to have in response to a disaster. During the early stages of a disaster it is hard to understand the true extent of damage, due to complications in communications and logistics. Some communities can be completely cut off due to various reasons, therefore the earlier satellite imagery is retrieved and analysed, the quicker decisions can be made to reduce further impact.
There are issues around how open and freely available high resolution satellite imagery is after a disaster which can inhibit the response. Having open source, high resolution imagery shortly after a disaster can allow for rapid disaster mapping to occur. This analysis helps communicate where the areas of high risk and importance are to allow for the first responders to assess how they might assist those areas of greatest need and desperation. A lack of satellite imagery after a disaster represents a lack of visualisation of the situation. A lack of visualisation means a poor understanding of the extent of the disaster and its consequences and therefore external help cannot be as effective in the attempt to send the relevant information or aid.
Rapid procurement of satellite imagery after a disaster is not only crucial for response but it can help for understanding future risk and impact. By visualising the extent of a disaster in the same place at different periods in time, alongside a control (the area in its natural state), trends for that particular area to a particular natural hazard can be understood. For example, Figure 4 shows the comparison between the river in its natural state (2018) and the river in a state of flooding (2019). It is notable that there are particular areas along the river that have burst their banks. If this data was then to be compared against the 2014 flood extent of the Lunga River, some trends may start to appear allowing for areas of vulnerability and future risk to be identified. Identifying these areas also leads to a better understanding of the impacts to the surrounding areas, therefore resilience measures can be put in place.
To ensure better response to future disasters, freely open and available high resolution satellite imagery is crucial. The resolution has to be high to capture the important and necessary features to inform the appropriate response. The imagery has to be freely available to allow for rapid disaster mapping to occur by external agencies, as during the early stages of response there can be other priorities for agencies on the ground. The imagery has to be taken as early as possible to gain a true understanding of the impact. For example, water retreat can occur rapidly, therefore the full extent of the disaster can be lost. Analysing satellite imagery after a disaster is the quickest way of understanding and visualising what has happened on the ground and can identify areas that could be of potential danger. It is crucial to have this information to reduce the impacts and devastation of a disaster.
Image courtesy: China GEO & CGSTL